Running a 180B 58Gb MoE model on a 30 GB RAM laptop Intel ARC B390


A measured benchmark of BigMoEonEdge with Qwen3.8-Flash-Next IQ1_M (180B 58Gb) run on 30Gb RAM, prompt processing, token generation
Not only Macbooks can run over-sized models
A model that is heavily quantized can still be far too big for the machine you own. The file in question Qwen3.8-Flash-Next-GSQ-RCO-IQ1_M, two GGUF shards, 58.4 GB on disk is a preview of the Qwen4 architecture (qwen4exp): 48 layers, 256 experts per layer, 10 experts routed per token, a 262,144-token context, and a 248k-token vocabulary. IQ1_M is roughly a one-bit quantization, so this is already the compressed version. It is still almost twice the 30 GiB of RAM in the test laptop (Intel Core Ultra X7 358H, 16 cores, 30 GiB RAM, NVMe, CachyOS).
An auto-sized cache with no explicit mapping policy does not work either. My first attempt enabled expert streaming but let the auto path size everything: it decided to reserve 29 GB for the dense conversion and never produced a token. The process climbed to ~29 GiB RSS, pushed 15 GB into zram, and drove MemAvailable down to ~12 MiB before it was killed. The machine is not merely slow in that regime; it stops being usable.
The saving grace is the sparsity. Ten of 256 experts means each token touches about 4 % of the expert weights. Keeping all 24 GB of experts in RAM is unnecessary — what matters is having the next token's experts ready, and remembering the ones used recently. That is the whole idea behind BigMoeOnEdge, the engine this benchmark exercises.
Running Big models that do not fit in RAM/VRAM
BigMoeOnEdge is a ports-and-adapters engine built on llama.cpp's public API (no in-tree patches). On a model that does not fit, it:
- reads only the routed experts from flash per token, with
O_DIRECTand parallel read lanes; - keeps a bounded LRU expert cache in RAM, so repeat experts are not re-read;
- can overlap the next layer's expert reads with compute;
- holds the small dense weights in RAM, while leaving huge row-gathered tables mapped.
That last point is the one that matters here. This model has a ~27.8 GB embedding group
(per_layer_token_embd.weight and token_embd.weight) that the graph only gathers a few rows from.
Treating it as copyable is what killed the naive run.
The planner's own output names the fix: pass those tables to --dense-mapped so they stay mapped, and stream the experts with a bounded cache.
The benchmark: a fixed 618-token prompt, 128 greedy decode tokens, four configurations that vary the decode thread count and the I/O overlap setting. A second sweep keeps those settings fixed and grows the context window from 2k to 16k tokens, with the prompt scaled to fill each window so the model actually has a long history to attend to. Two numbers are reported the way llama-bench names them — pp (prompt processing, tok/s) and tg (token generation, tok/s) — plus peak process RAM. RAM is read both from the engine's own per-token CSV (rss_mib) and, in separate verification
runs, from the kernel's VmRSS/VmHWM for the actual engine PID.
How to run the benchmark
The command for the main configuration:
MODEL=/home/g/Code/llama.cpp/models/Qwen3.8-Flash-Next-GSQ-RCO-IQ1_M-00001-of-00002.gguf
bmoe-cli -m "$MODEL" --chatml -n 128 \
  --dense-weights anon --io-threads 4 \
  --moe-stream --cache-mb 18000 \
  --dense-mapped 'per_layer_token_embd.weight;token_embd.weight' \
  --threads 16 --overlap \
  --csv main.csv -p "$PROMPT"
The other three runs change only --threads 16|8|4 and the presence of --overlap.--cache-mb 18000 is deliberately a little under the planner's 23.6 GiB suggestion, to leave the
desktop some headroom.
Results
| Config | pp (prefill tok/s) | tg (decode tok/s) | Peak RSS | Expert cache hit |
|---|---|---|---|---|
| 16 threads + overlap | 34.9 | 4.86 | 22.2 GiB | 82.4 % |
| 16 threads, serial I/O | 32.1 | 4.75 | 21.7 GiB | 83.0 % |
| 8 threads + overlap | 28.1 | 4.48 | 21.5 GiB | 80.6 % |
| 4 threads + overlap | 21.6 | 3.71 | 20.7 GiB | 81.7 % |
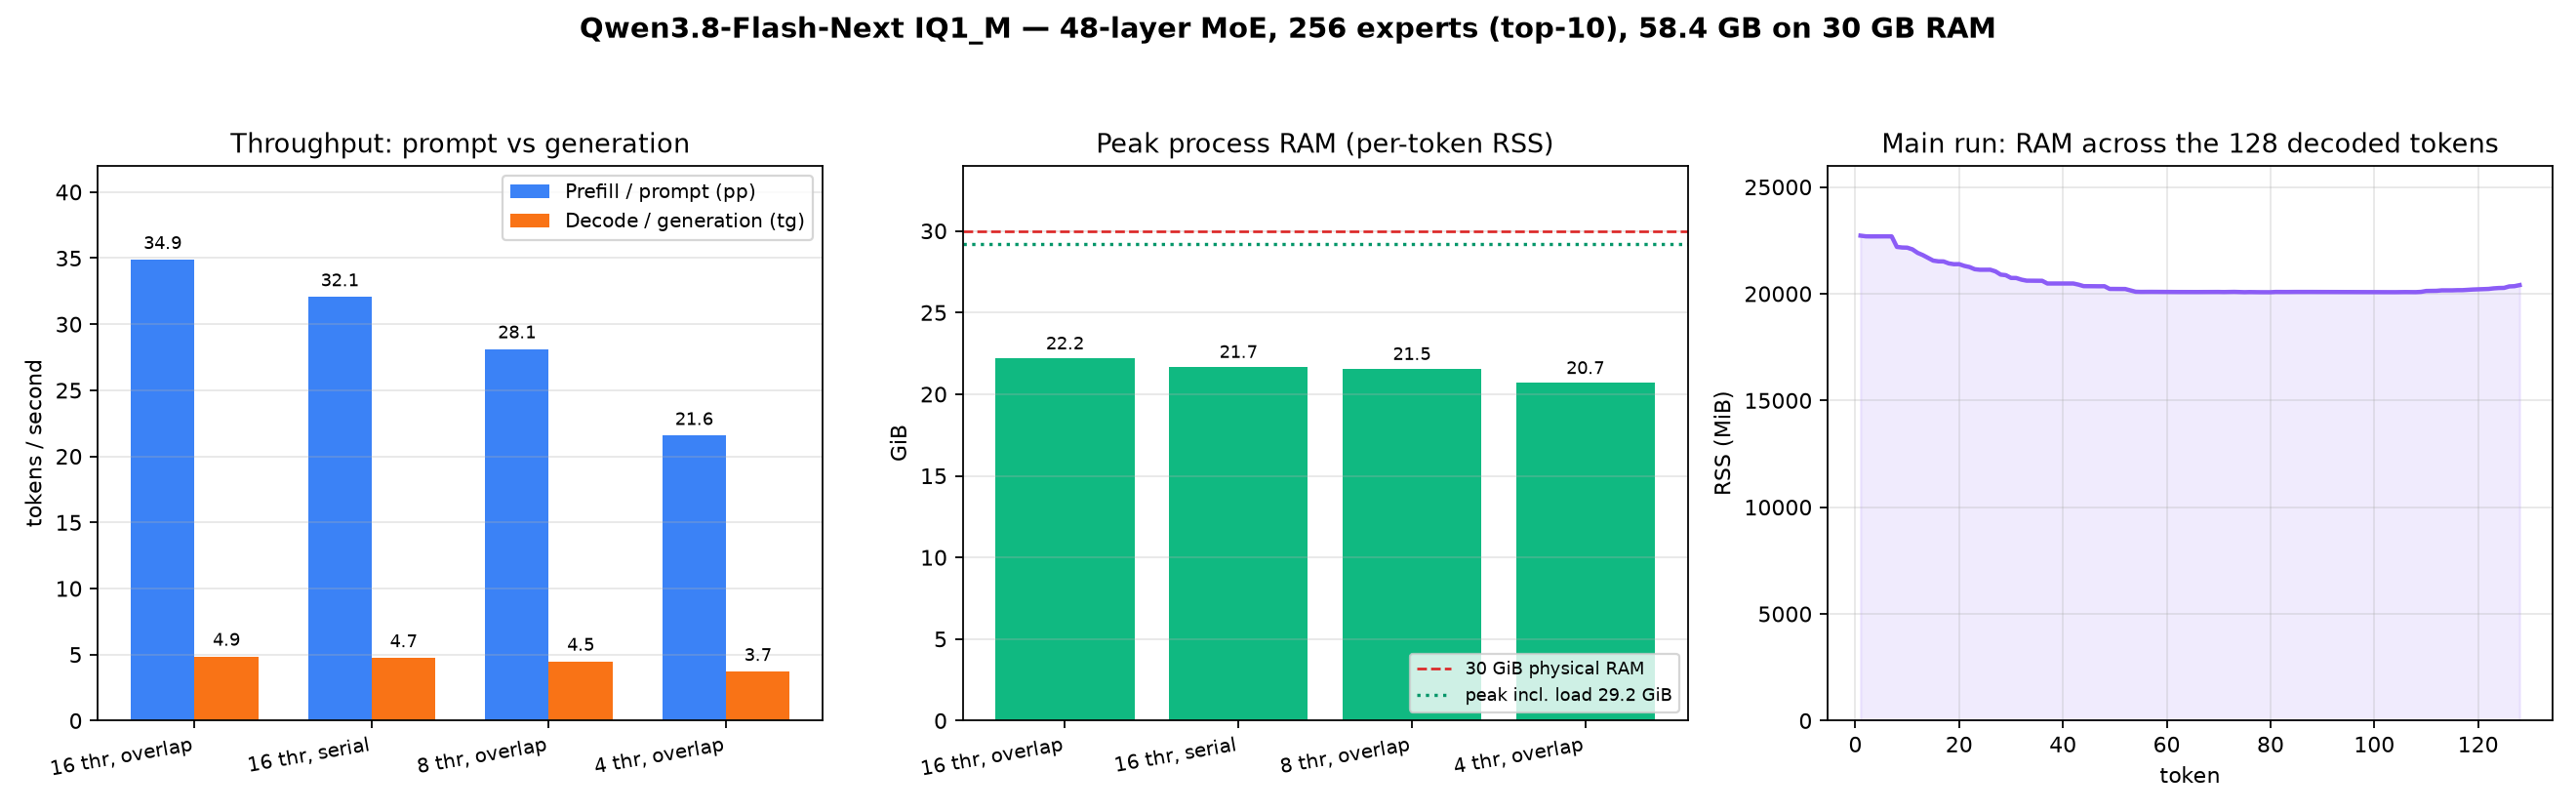
The verification run sampled the engine PID from load through the last token, and it shows that "RAM used" has two different values. Loading and converting the dense weights briefly peak at 29.2 GiB RSS (VmHWM) — essentially the entire 30 GiB, with a peak of 2.5 GiB in zram swap. Once decoding starts the resident set drops to a steady ~22 GiB and stays there. The tightest point left 4.8 GiB available to the rest of the system, against ~12 MiB in the naive attempt. It is close to the limit during load, but on the right side of it; the earlier failure is what the wrong configuration looks like.
Reading the numbers
- Prompt processing is ~7× faster per token than generation. Prefill computes a wide graph (hundreds of tokens at once); decode is one token at a time and, with streaming, waits on flash. The 618-token prompt was prefilled in about 18 s (35 tok/s), while 128 generated tokens took about 26 s (4.9 tok/s).
- Thread count is the clean lever: 16 → 8 → 4 threads costs ~8 % then ~17 % of decode throughput. This CPU has 16 physical cores and the planner's own quantized-matmul sweep chose 16.
- Overlap is within noise here (4.86 vs 4.75 tok/s). The flash term is ~51 ms/token of summed read-lane time, but only ~17 ms/token of it actually stalls the compute graph, so there is little left to hide. The ~2 % difference is smaller than the run-to-run variation in cache hit rate (79–83 %), so it should not be read as a win.
- Each decode token's expert working set is ~937 MiB. The cache served ~82 % of the lookups and the engine read 46 MiB per token from NVMe (5.9 GB over the 128 tokens). Prefill, by contrast, reads every expert of every layer: ~19 GB for the prompt. That is why streaming makes the model usable at all: a miss is a local, tens-of-milliseconds event, not a page-in of the whole 58 GB file.
Growing the context window
The second sweep asks the obvious follow-up: does a longer history make the model slower? Each point is a fresh load with a prompt sized to roughly 85 % of the window, so prefill really processes that many tokens and decode runs with that much history in the KV cache.
| Context | Prompt tokens | pp (prefill tok/s) | tg (decode tok/s) | Time to first token | Decode RSS | Peak RSS (incl. load) |
|---|---|---|---|---|---|---|
| 2k | 1,748 | 44.5 | 4.81 | 39 s | 21.5 GiB | 26.8 GiB |
| 4k | 3,578 | 46.1 | 4.78 | 78 s | 22.5 GiB | 27.4 GiB |
| 8k | 7,239 | 45.5 | 4.94 | 159 s | 24.1 GiB | 27.0 GiB |
| 16k | 13,964 | 44.2 | 4.94 | 316 s | 24.8 GiB | 29.1 GiB |
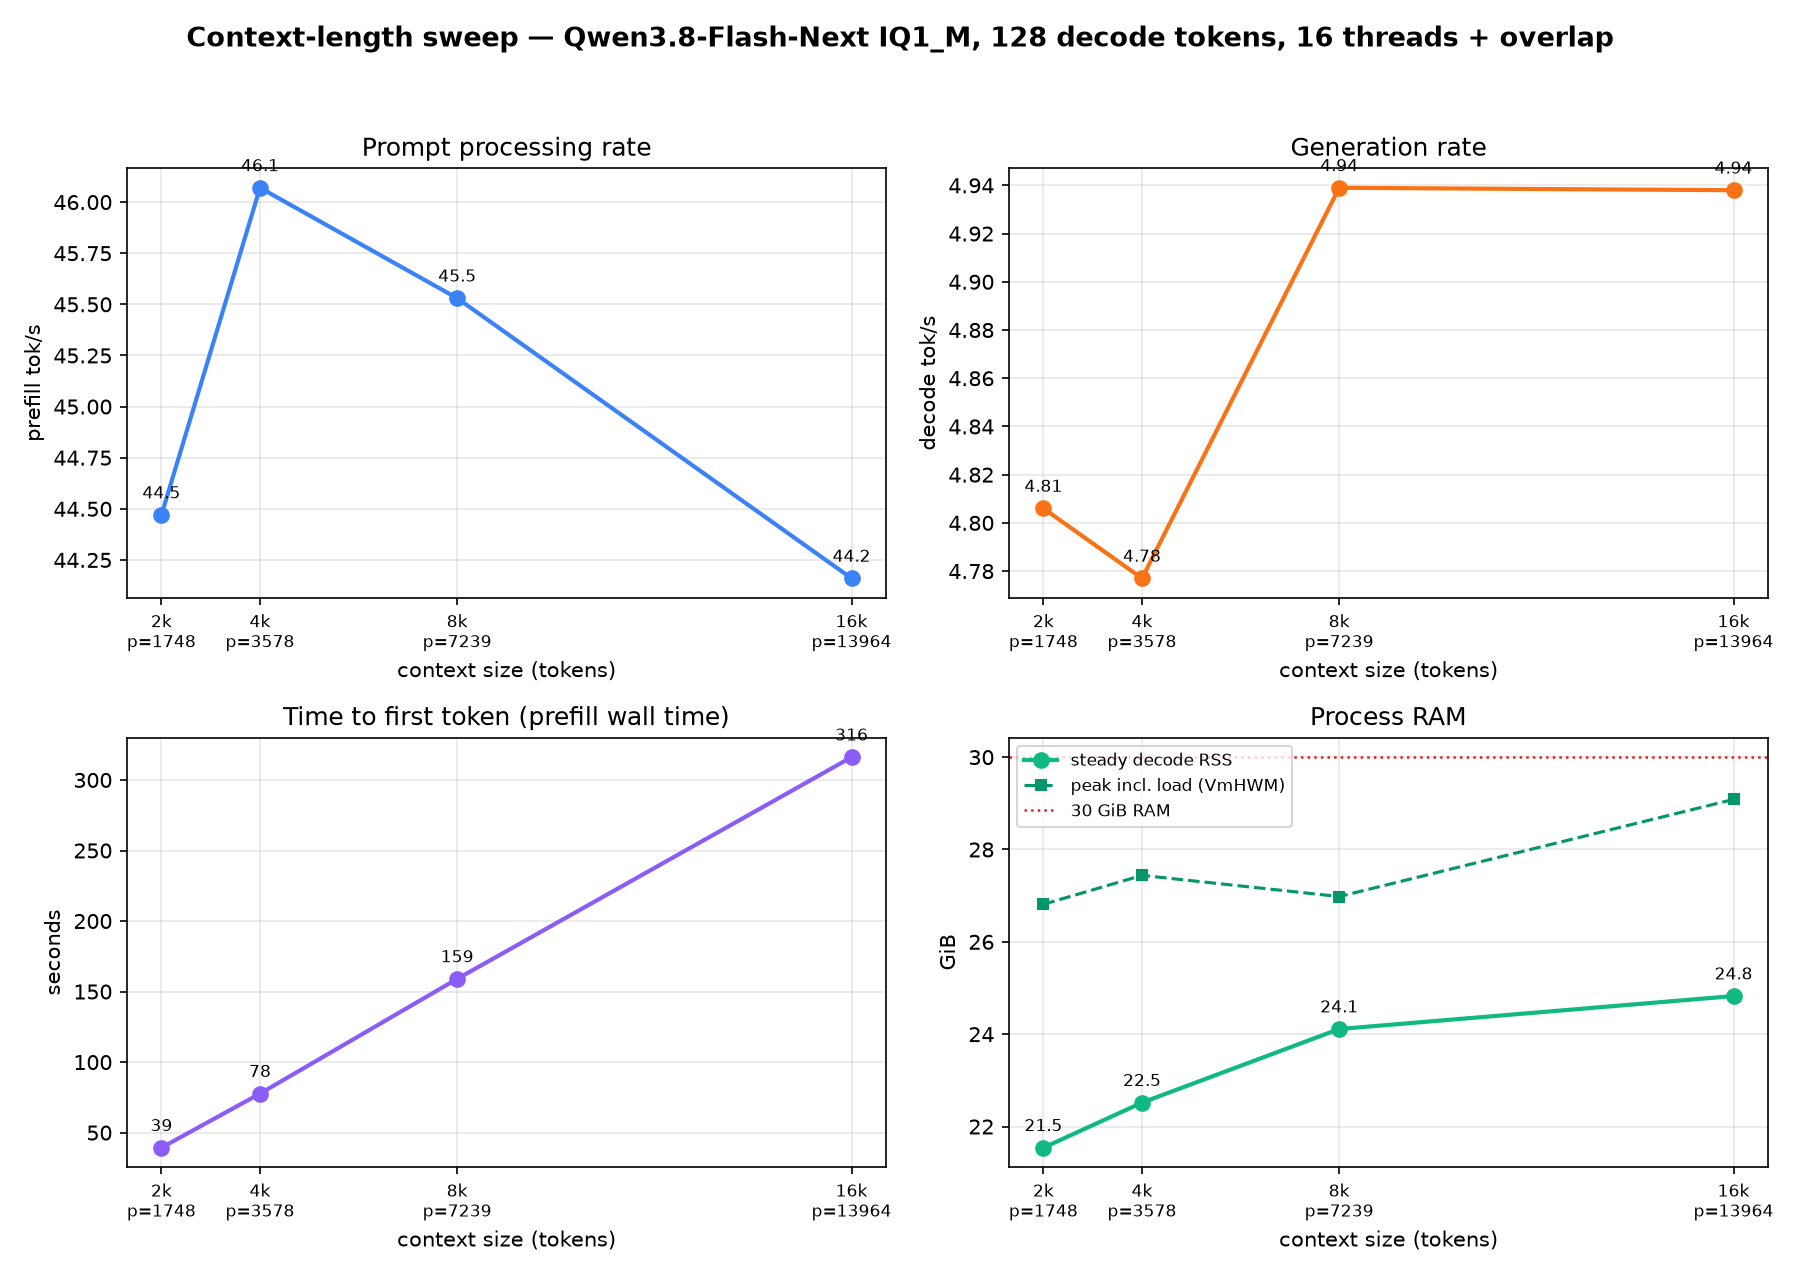
- Throughput is essentially flat. pp stays within 44–46 tok/s and tg within 4.78–4.94 tok/s from 1.7k to 14k tokens. The differences are within the cache-hit noise (78.5–80.2 % here). There is no measurable attention penalty: this architecture uses full attention only every fourth layer (
full_attention_interval = 4), with 2 KV heads and a q8_0 KV cache, so the per-token history read stays small. - What grows is the wait before the first token. Prefill time is almost perfectly linear in prompt length — 39 s at 1.7k tokens, 316 s at 14k, about 22.6 ms per prompt token. The rate is constant; you simply pay it for every token in what you ask.
- RAM grows modestly: steady decode RSS rises from 21.5 to 24.8 GiB as the KV cache and wider compute buffers are reserved, and the load-time peak reaches 29.1 GiB at 16k — again close to the 30 GiB ceiling. About 2 GiB of zram swap was used in each of these runs.
Caveats
One 128-token run per configuration, with a single prompt. Small differences (overlap on/off) are not statistically meaningful. The cache hit rate drifts between runs, so tok/s is not perfectly comparable across rows: the separate RAM-verification run, with the same flags as the main row, measured 4.45 tok/s at a 79.0 % hit rate, against 4.86 tok/s at 82.4 % for the main row. The machine also has an iGPU the planner can use for a ~1.8× faster prefill; this benchmark deliberately kept everything on the CPU to isolate streaming behaviour. The context sweep is not one long conversation grown incrementally: every point is a fresh load, and it stops at 16k of the model's advertised 262k. These are engineering measurements, not a quality or perplexity check.
Reproduce it
The engine and its benchmark protocol are documented in the project's docs/benchmark-method.md.
The key points for this model are: pass both embedding tables to --dense-mapped, keep the cache bounded, and do not let the auto-reserve path copy the 27.8 GB table into RAM.